
ggPopi provides tidy, publication-oriented ggplot2 workflows for common population-genomics plots. It combines typed import helpers, direct plot_*() functions, and composable ggpop() + geom_*() layers.
Supported modules include GWAS Manhattan and Q-Q plots, PCA, admixture, population statistics, LD decay, selective sweep scans, introgression summaries, and demographic / effective population size histories.
Installation
Install the development version from GitHub:
# install.packages("pak")
pak::pak("WWz33/ggPopi")
Core plotting uses CRAN-available dependencies. Optional integrations use:
Quick Start
library(ggPopi)

gwas <- import_gwas(
  system.file("extdata", "gwas", "gcta.mlma", package = "ggPopi"),
  type = "gcta"
)

plot_manha(gwas)
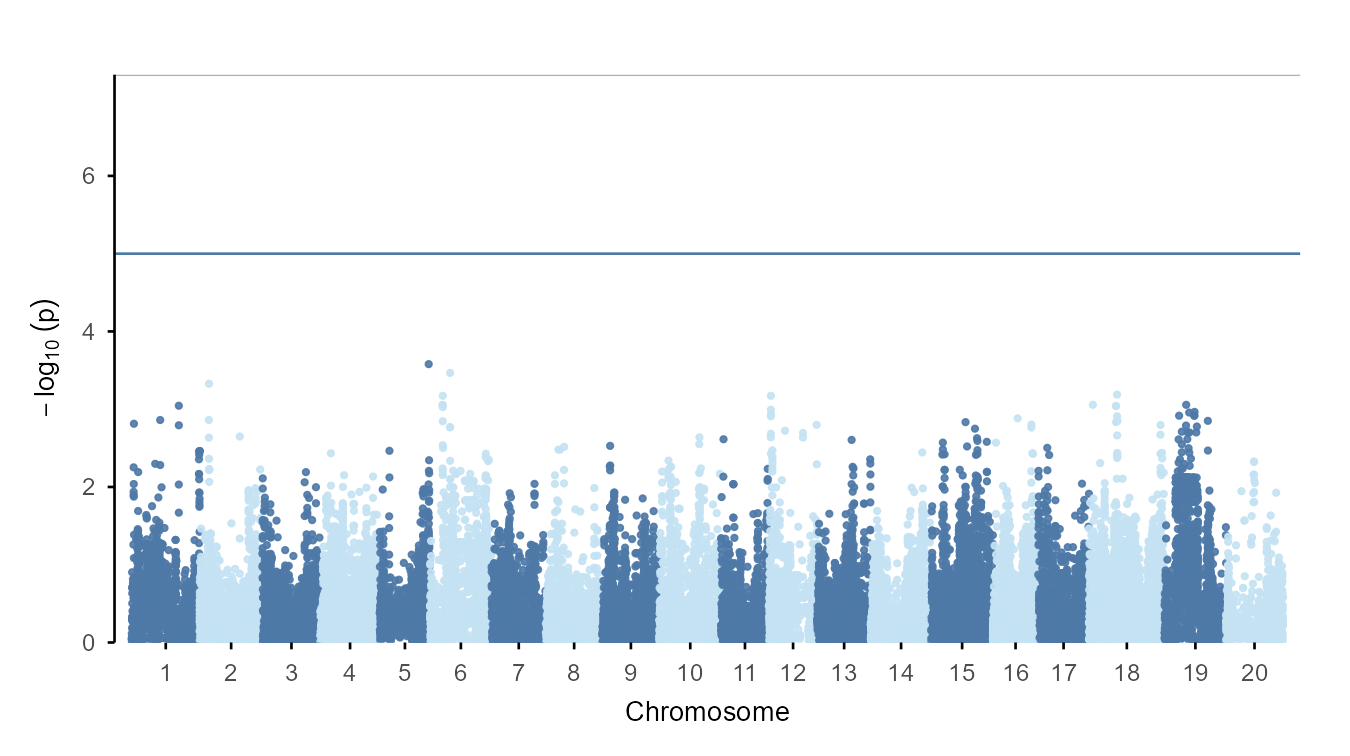
The same imported object can be used through the layered ggplot extension path:
gwas |>
  ggpop() +
  geom_manha()
Interface
Every module follows the same shape:
-
import_*()reads tool output into a typed data frame. -
plot_*()returns a completeggplotobject with module defaults. -
ggpop() + geom_*()provides the same visual grammar inside a ggplot pipeline.
| Module | Import | Direct plot | ggplot extension | Guide |
|---|---|---|---|---|
| GWAS | import_gwas() |
plot_manha(), plot_qq()
|
geom_manha(), geom_qq()
|
GWAS |
| PCA |
import_pca(), compute_pca()
|
plot_pca() |
geom_pca() |
PCA |
| Admixture | import_admix() |
plot_admix(), plot_admix2()
|
geom_admix(), geom_admix2()
|
Admixture |
| Population statistics | import_stats() |
plot_stats() |
geom_stats() |
Stats |
| LD decay | import_ld_decay() |
plot_ld_decay() |
geom_ld_decay() |
LD decay |
| Selective sweeps | import_selection() |
plot_selection() |
geom_selection() |
Selection |
| Introgression | import_introgression() |
plot_introgression() |
geom_introgression() |
Introgression |
| Demographic / Ne history |
import_ne_history(), import_demographic_history()
|
plot_ne_history(), plot_demographic_history()
|
geom_ne_history(), geom_demographic_history()
|
Ne history |
Documentation
- Getting started: https://wwz33.github.io/ggPopi/articles/ggPopi.html
- Function reference: https://wwz33.github.io/ggPopi/reference/
- Compatibility helpers: https://wwz33.github.io/ggPopi/articles/guides/compatibility.html
Design
ggPopi keeps the user-facing API small while preserving module-specific visual defaults. Direct plot_*() functions are the reference style, and matching geom_*() layers make those defaults available in ggplot compositions.
Palette and theme helpers such as ggpop_palette(), scale_colour_ggpop(), scale_fill_ggpop(), and theme_tidyplot() provide shared styling across modules.