
ggpop supports Manhattan and Q-Q plots from common GWAS
outputs. The intended flow is:
- import a typed object;
- plot with
plot_manha()/plot_qq()orggpop() + geom_*(); - use internal fastman-style Manhattan and Q-Q plotting behavior
without an external
fastmandependency.
API summary
| Task | Direct API | Layer API | Notes |
|---|---|---|---|
| Import GCTA/GEMMA/EMMAX | import_gwas(file, type = ...) |
- | Returns ggpop_gwas
|
| Manhattan | plot_manha() |
ggpop(data) + geom_manha() |
Defaults are aligned |
| Q-Q | plot_qq() |
ggpop(data) + ggPopi::geom_qq() |
Use explicit namespace to avoid ggplot2::geom_qq()
|
| Backend | internal fastman-style layout | native ggpop stat | Direct wrappers and geoms share one implementation |
GCTA example
gwas <- import_gwas(ggpop_extdata("gwas", "gcta.mlma"), type = "gcta")
plot_manha(gwas)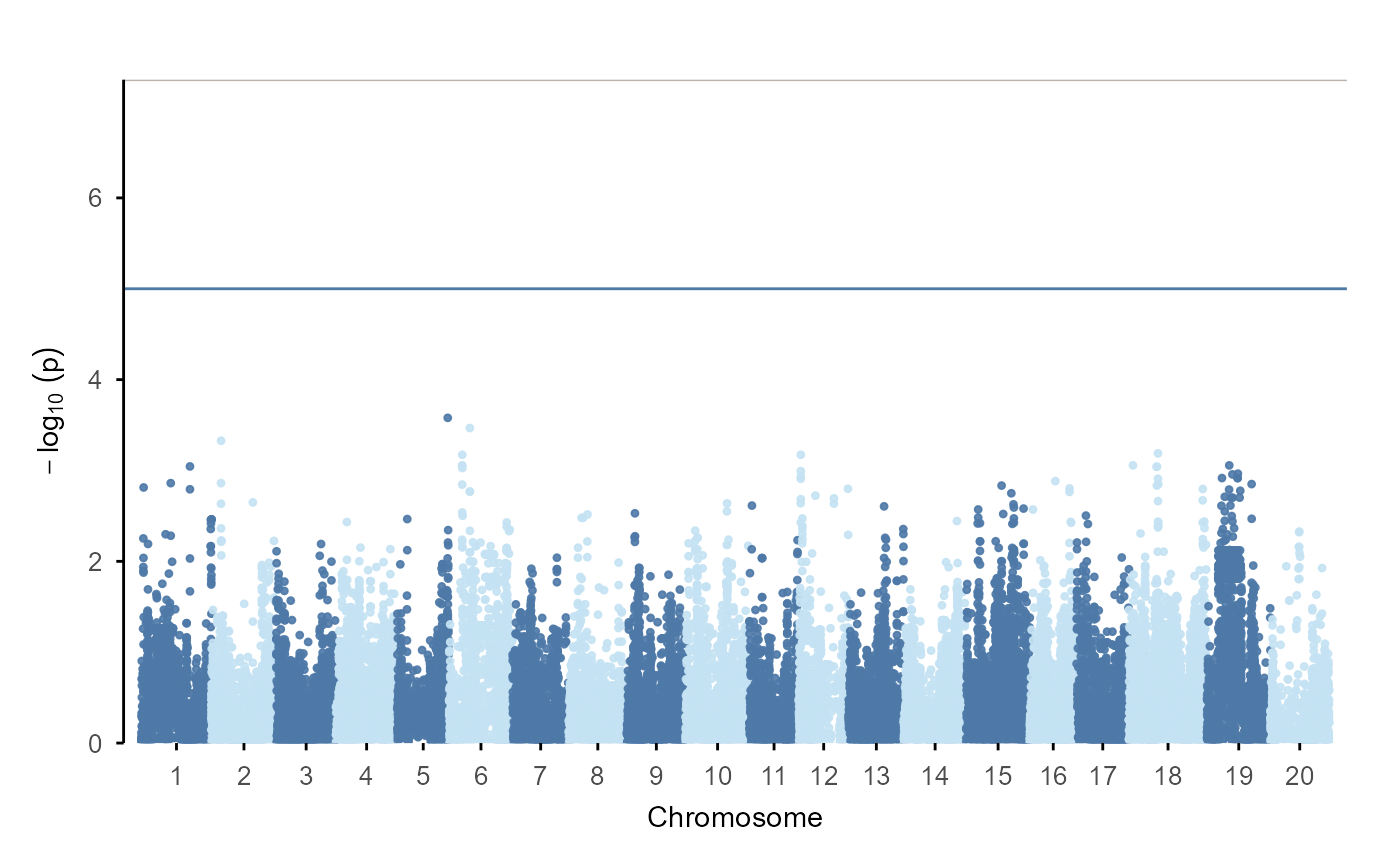
plot_qq(gwas)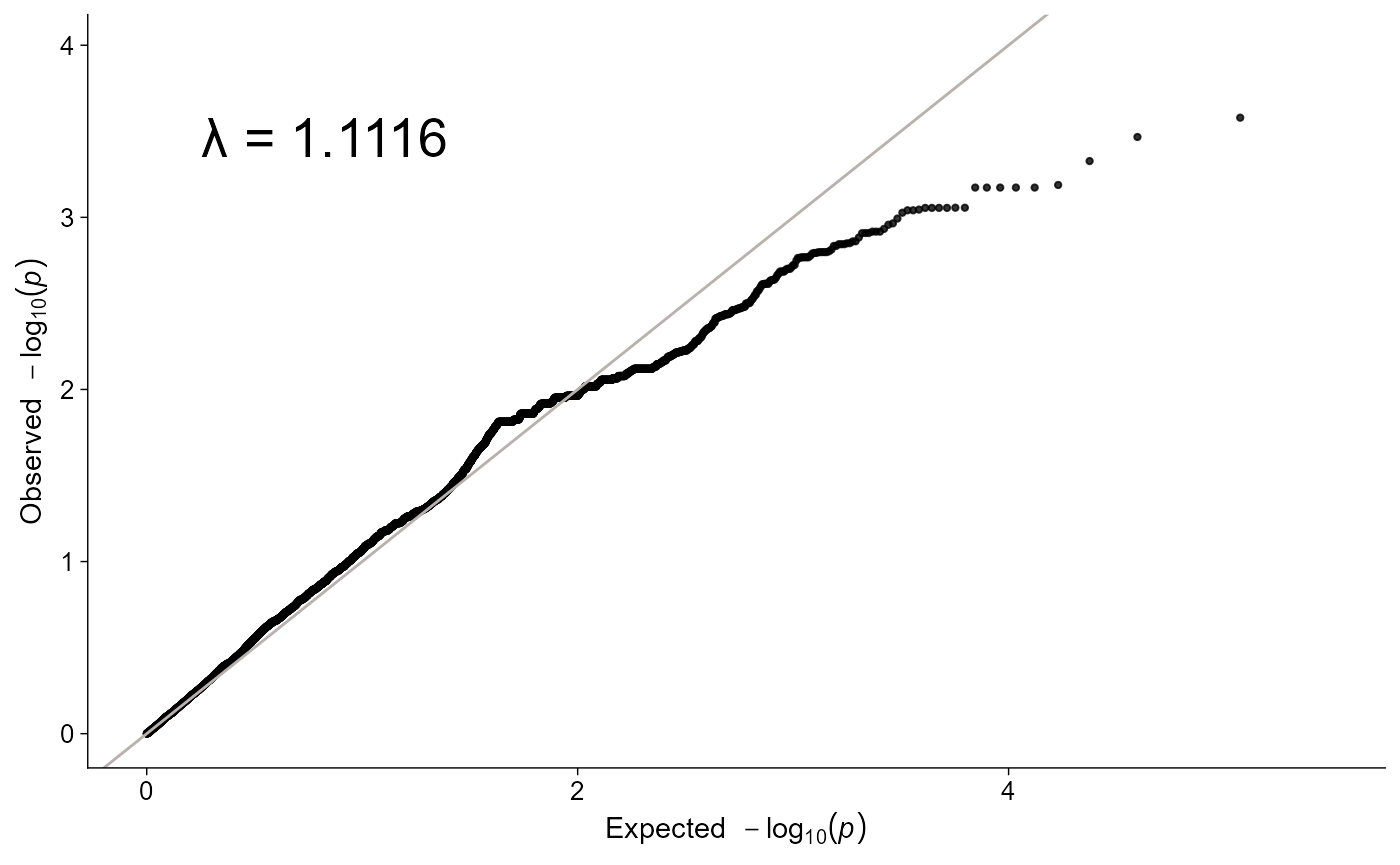
Layered workflow
gwas |>
  ggpop() +
  geom_manha()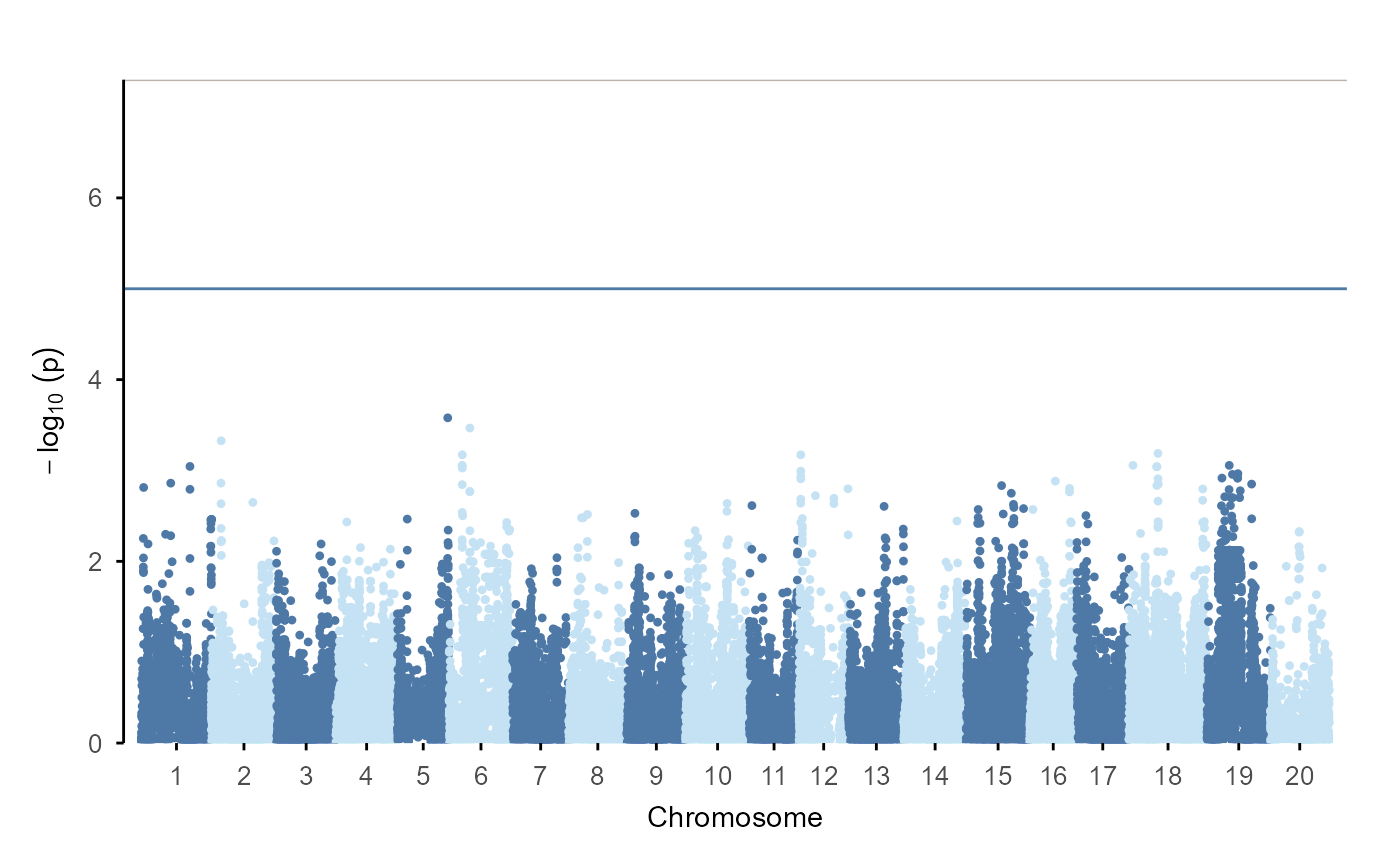
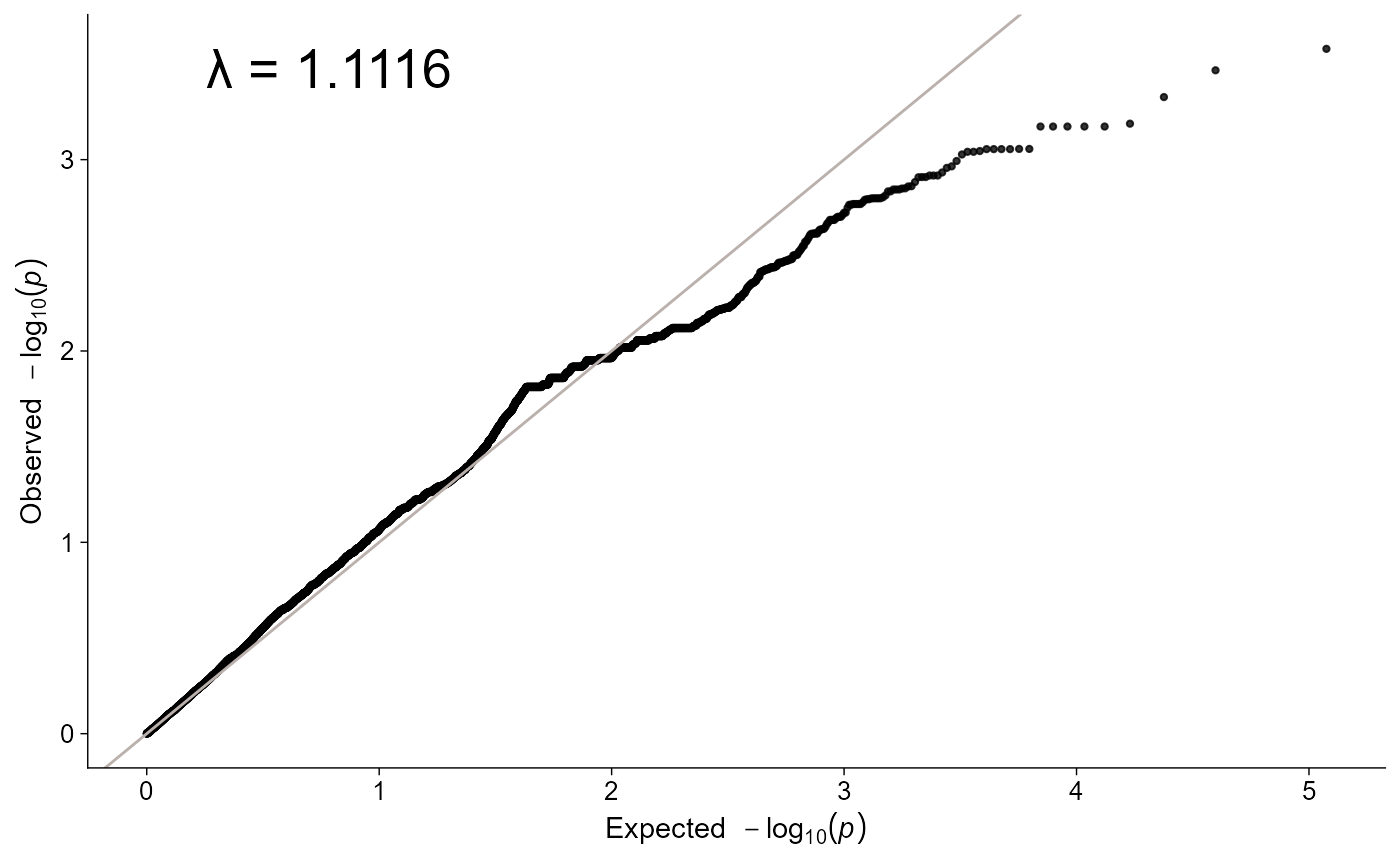
plot_manha(gwas) and
ggpop(gwas) + geom_manha() share the same default threshold
and suggestive reference lines.
GWAS colour palettes
The GWAS module uses the same unified discrete palette entry as the
rest of ggpop. Manhattan plots default to a two-colour
alternating chromosome palette:
plot_manha(gwas, palette = "manhattan")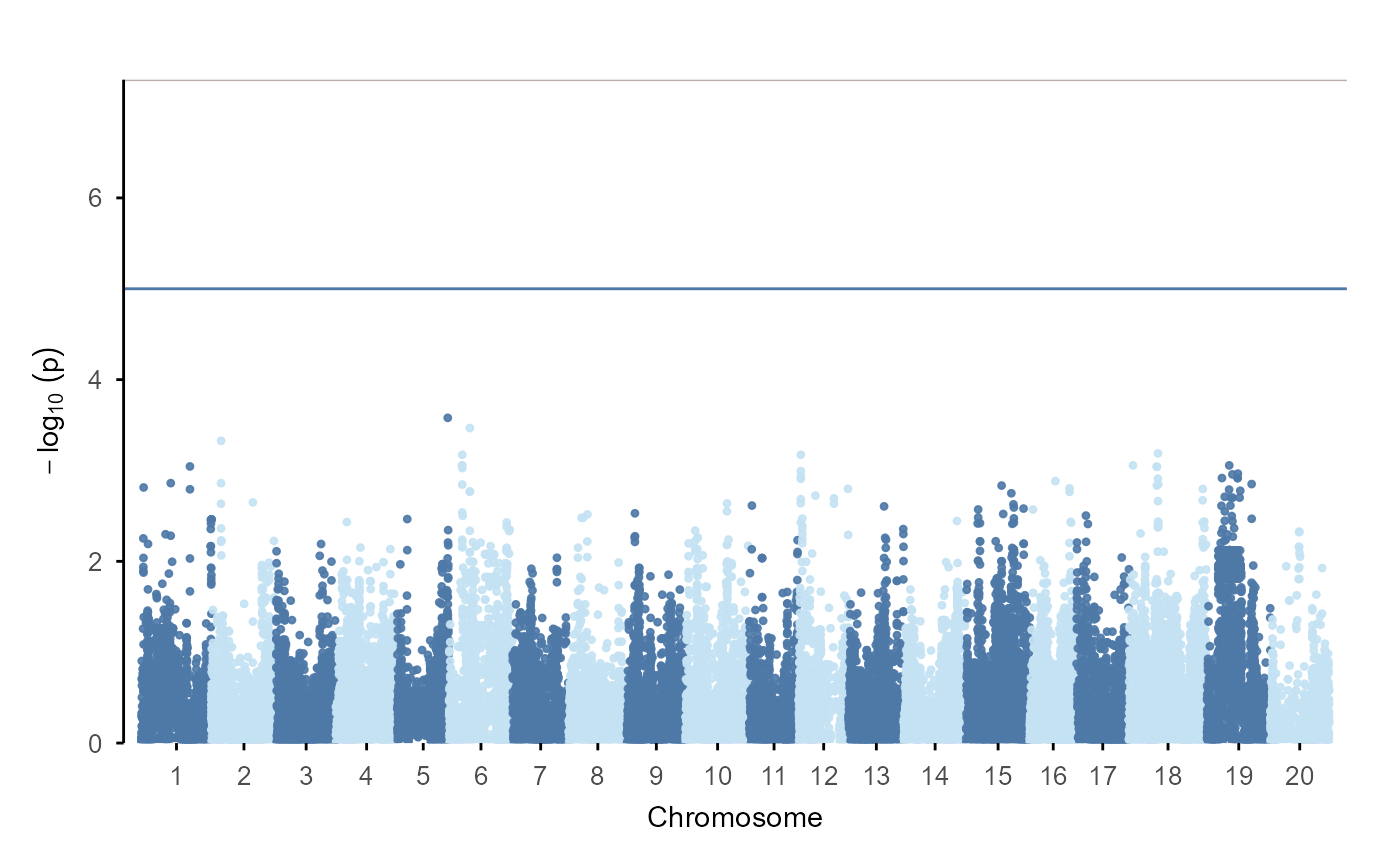
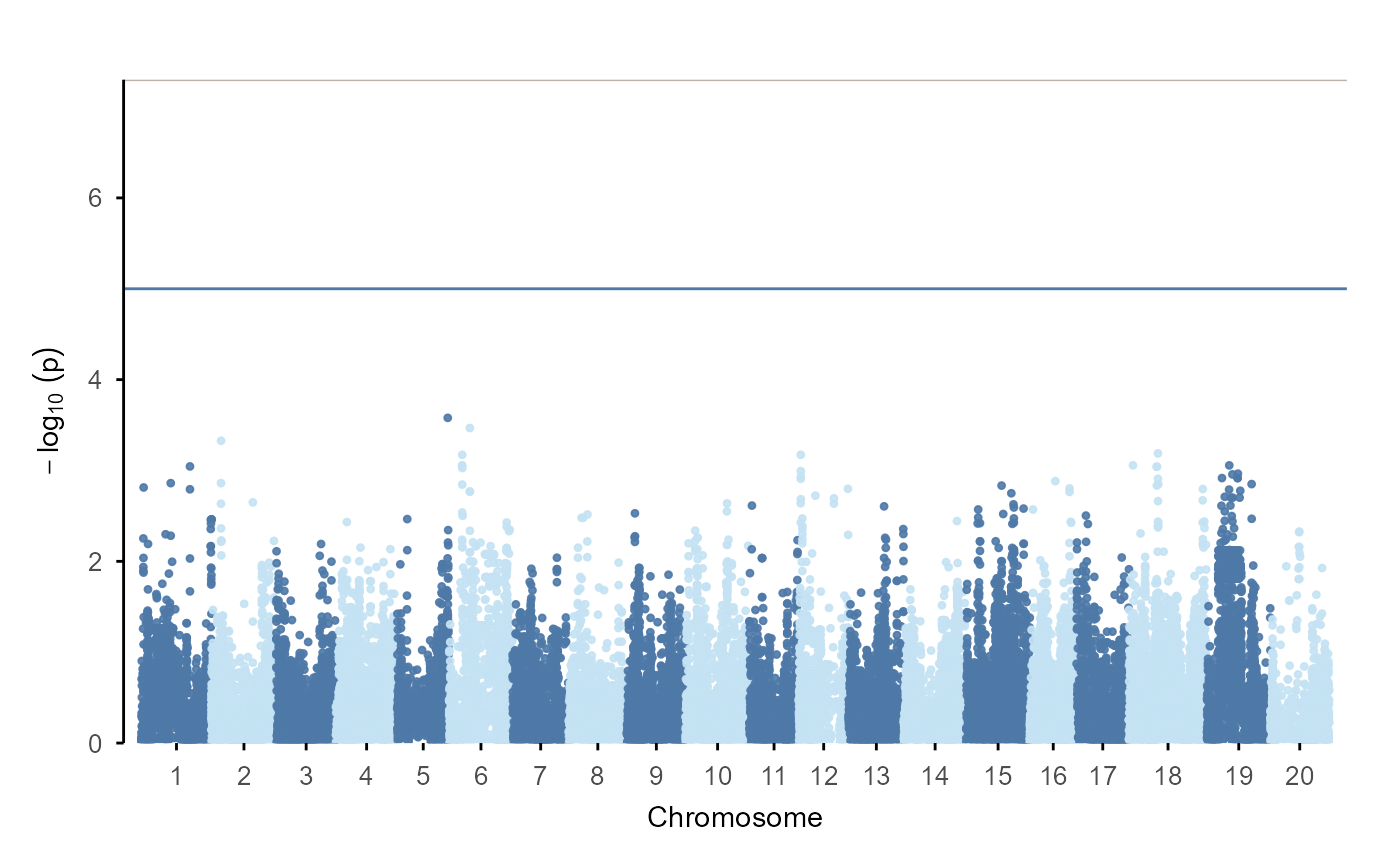
To override the Manhattan colours, pass two explicit colours.
binary = TRUE keeps the two-colour alternation even when a
longer palette is supplied:
plot_manha(
  gwas,
  palette = c("#4E79A7", "#C4E2F3"),
  binary = TRUE
)
Reference-line colours continue to use the publication palette by
default. Override them with threshold_color and
suggestive_color when needed.
Alternative GWAS formats
import_gwas() accepts type = "gcta",
type = "gemma", and type = "emmax". GWAS
plotting uses ggpop’s internal ggplot implementation in both direct and
layered workflows.