Bar plot of the relative gene expression (\(\Delta C_T\) method) from the qpcrANOVARE output of a two-factorial experiment data
Source: R/twoFACTORplot.r
twoFACTORplot.RdBar plot of the relative expression (\(\Delta C_T\) method) of a gene along with the standard error (se), 95% confidence interval (ci) and significance
twoFACTORplot(
  res,
  x.axis.factor,
  group.factor,
  width = 0.5,
  fill = "Blues",
  y.axis.adjust = 0.5,
  y.axis.by = 2,
  show.errorbars = TRUE,
  errorbar,
  show.letters = TRUE,
  letter.position.adjust = 0.1,
  ylab = "Relative Expression",
  xlab = "none",
  legend.position = c(0.09, 0.8),
  fontsize = 12,
  fontsizePvalue = 5,
  axis.text.x.angle = 0,
  axis.text.x.hjust = 0.5
)
Arguments
- res
the FC data frame created by
qpcrANOVARE(x)$Resultfunction on a two factor data such asdata_2factor.- x.axis.factor
x-axis factor.
- group.factor
grouping factor.
- width
a positive number determining bar width.
- fill
specify the fill color vector for the columns of the bar plot. One of the palettes in
display.brewer.all(e.g. "Reds" or "Blues", ...) can be applied.- y.axis.adjust
a negative or positive number for reducing or increasing the length of the y axis.
- y.axis.by
determines y axis step length.
- show.errorbars
show errorbars
- errorbar
Type of error bar, can be
seorci.- show.letters
a logical variable. If TRUE, mean grouping letters are added to the bars.
- letter.position.adjust
adjust the distance between the grouping letters to the error bars.
- ylab
the title of the y axis.
- xlab
the title of the x axis.
- legend.position
a two digit vector specifying the legend position.
- fontsize
size of all fonts of the plot.
- fontsizePvalue
font size of the pvalue labels
- axis.text.x.angle
angle of x axis text
- axis.text.x.hjust
horizontal justification of x axis text
Value
Bar plot of the average fold change for target genes along with the standard error or 95% confidence interval as error bars.
Details
The twoFACTORplot function generates the bar plot of the average fold change for target genes along with the significance, standard error (se) and the 95% confidence interval (ci) as error bars.
Examples
# See a sample data frame
data_2factor
#>    Genotype Drought Rep EPO  POCt EGAPDH GAPDHCt
#> 1         R      D0   1   2 33.30      2   31.53
#> 2         R      D0   2   2 33.39      2   31.57
#> 3         R      D0   3   2 33.34      2   31.50
#> 4         R      D1   1   2 32.73      2   31.30
#> 5         R      D1   2   2 32.46      2   32.55
#> 6         R      D1   3   2 32.60      2   31.92
#> 7         R      D2   1   2 33.48      2   33.30
#> 8         R      D2   2   2 33.27      2   33.37
#> 9         R      D2   3   2 33.32      2   33.35
#> 10        S      D0   1   2 26.85      2   26.94
#> 11        S      D0   2   2 28.17      2   27.69
#> 12        S      D0   3   2 27.99      2   27.39
#> 13        S      D1   1   2 30.41      2   28.70
#> 14        S      D1   2   2 29.49      2   28.66
#> 15        S      D1   3   2 29.98      2   28.71
#> 16        S      D2   1   2 29.03      2   30.61
#> 17        S      D2   2   2 28.73      2   30.20
#> 18        S      D2   3   2 28.83      2   30.49

# Before generating plot, the result table needs to be extracted as below:
res <- qpcrANOVARE(data_2factor, numberOfrefGenes = 1, block = NULL)$Result
#> Analysis of Variance Table
#>
#> Response: wDCt
#>           Df  Sum Sq Mean Sq F value    Pr(>F)
#> T          5 20.5489  4.1098  26.267 4.515e-06 ***
#> Residuals 12  1.8775  0.1565
#> ---
#> Signif. codes:  0 '***' 0.001 '**' 0.01 '*' 0.05 '.' 0.1 ' ' 1
#>
#> Relative expression table
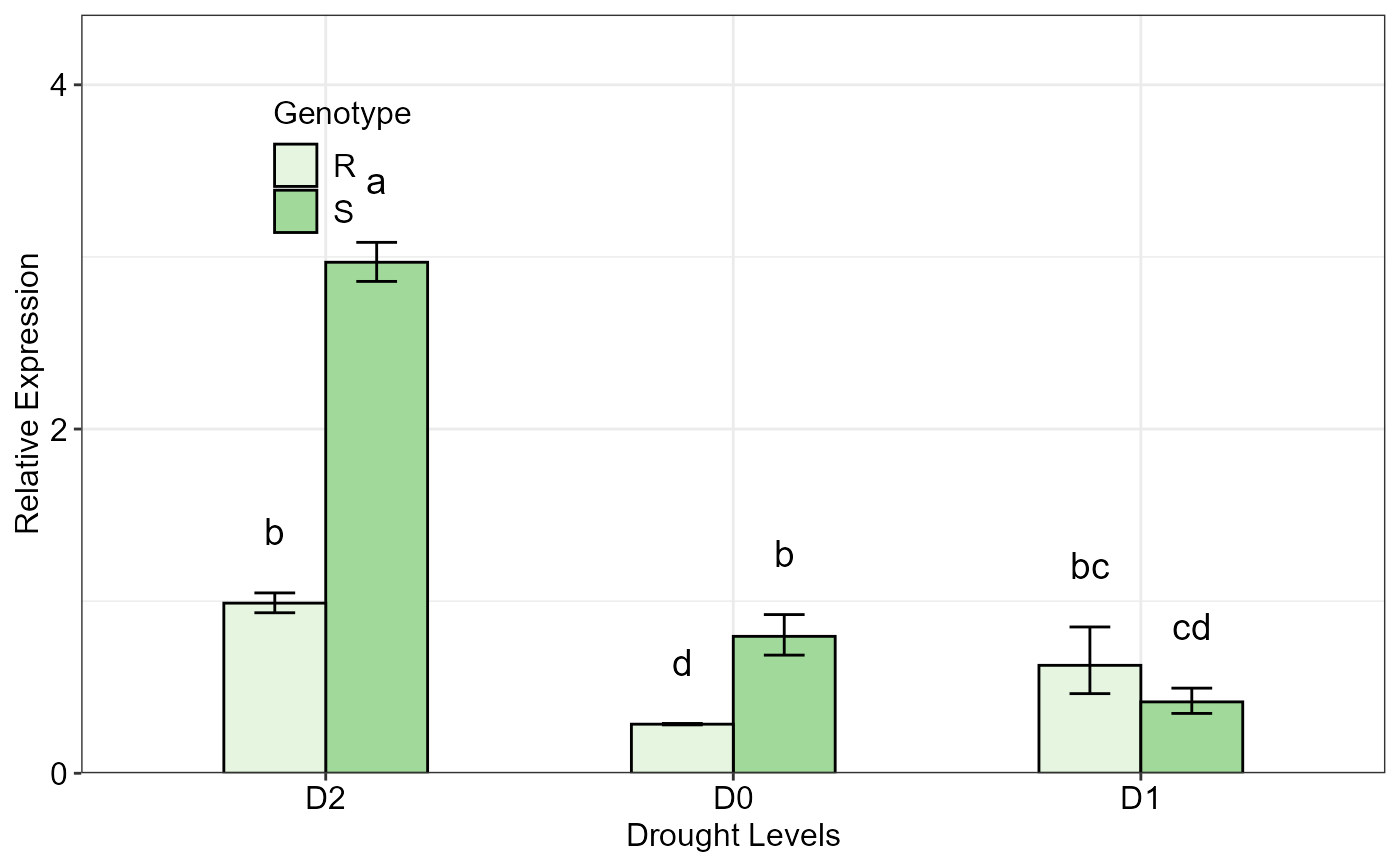
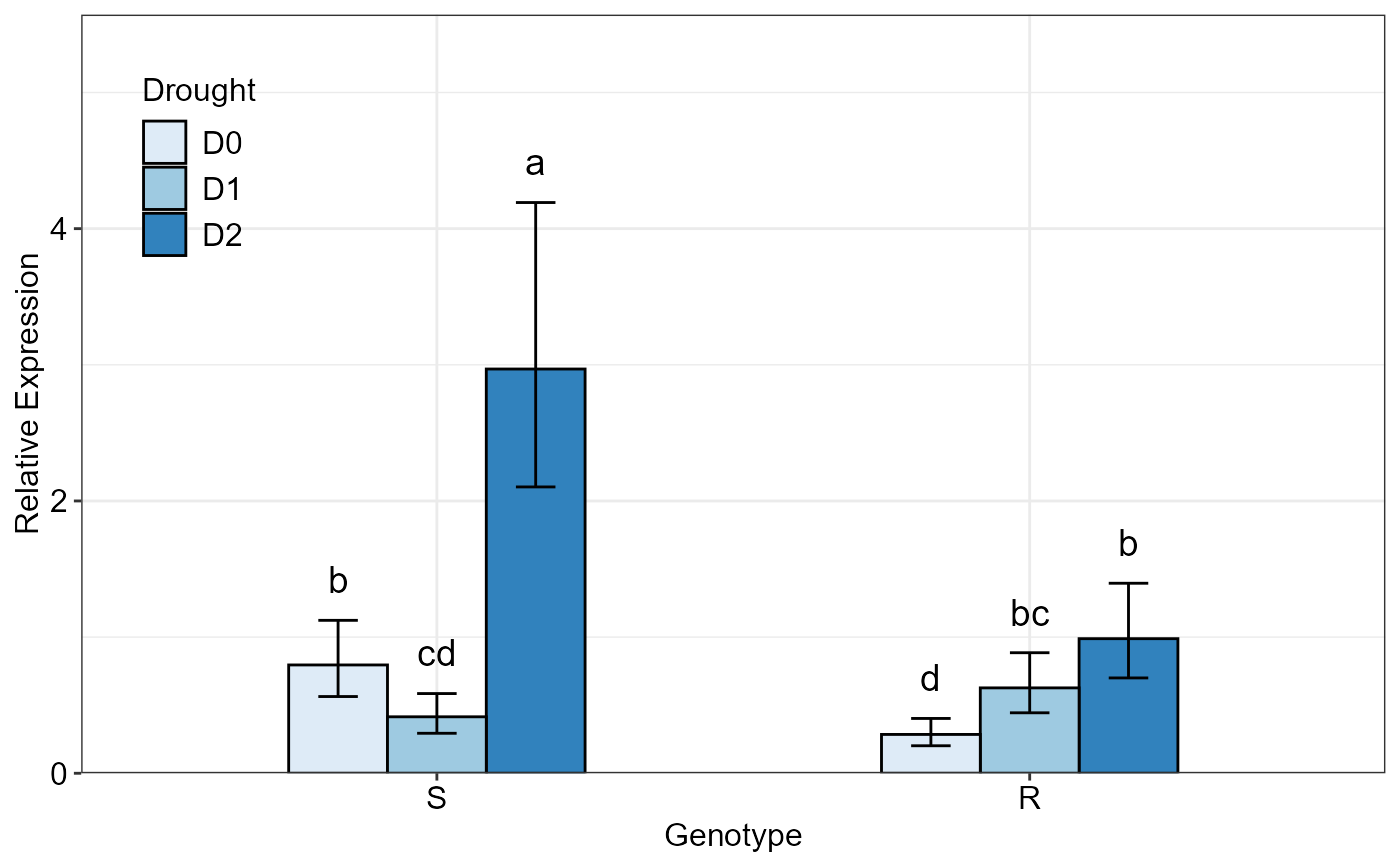
#>   Genotype Drought     RE    LCL    UCL     se Lower.se Upper.se letters
#> 1        S      D2 2.9690 2.1030 4.1918 0.0551   2.8577   3.0846    a
#> 2        R      D2 0.9885 0.7002 1.3956 0.0841   0.9325   1.0478     b
#> 3        S      D0 0.7955 0.5635 1.1232 0.2128   0.6864   0.9219     b
#> 4        R      D1 0.6271 0.4441 0.8853 0.4388   0.4626   0.8500     bc
#> 5        S      D1 0.4147 0.2937 0.5854 0.2540   0.3478   0.4945      cd
#> 6        R      D0 0.2852 0.2020 0.4026 0.0208   0.2811   0.2893       d

# Plot of the 'res' data with 'Genotype' as grouping factor
twoFACTORplot(res,
   x.axis.factor = Drought,
   group.factor = Genotype,
   width = 0.5,
   fill = "Greens",
   y.axis.adjust = 1,
   y.axis.by = 2,
   ylab = "Relative Expression",
   xlab = "Drought Levels",
   letter.position.adjust = 0.2,
   legend.position = c(0.2, 0.8),
   errorbar = "se")


# Plotting the same data with 'Drought' as grouping factor
twoFACTORplot(res,
              x.axis.factor = Genotype,
              group.factor = Drought,
              xlab = "Genotype",
              fill = "Blues",
              fontsizePvalue = 5,
              errorbar = "ci")


# Combining FC results of two different genes:
a <- qpcrREPEATED(data_repeated_measure_1,
                  numberOfrefGenes = 1,
                  factor = "time", block = NULL, plot = FALSE)
#> Warning: The level 1  of the selected factor was used as calibrator.
#> Type III Analysis of Variance Table with Satterthwaite's method
#>      Sum Sq Mean Sq NumDF DenDF F value  Pr(>F)
#> time 11.073  5.5364     2     4  4.5382 0.09357 .
#> ---
#> Signif. codes:  0 '***' 0.001 '**' 0.01 '*' 0.05 '.' 0.1 ' ' 1
#>
#> Fold Change table
#>         contrast     FC pvalue sig    LCL     UCL     se Lower.se Upper.se
#> 1          time1 1.0000 1.0000     0.0000  0.0000 1.4051   0.3776   2.6484
#> 2 time2 vs time1 0.8566 0.8166     0.0923  7.9492 0.9753   0.4357   1.6841
#> 3 time3 vs time1 4.7022 0.0685   . 0.5067 43.6368 0.5541   3.2026   6.9040

b <- qpcrREPEATED(data_repeated_measure_2,
                  factor = "time",
                  numberOfrefGenes = 1, block = NULL, plot = FALSE)
#> Warning: The level 1  of the selected factor was used as calibrator.
#> NOTE: Results may be misleading due to involvement in interactions
#> Type III Analysis of Variance Table with Satterthwaite's method
#>                Sum Sq Mean Sq NumDF DenDF F value  Pr(>F)
#> time           5.9166 2.95832     2     8  3.4888 0.08139 .
#> treatment      0.6773 0.67728     1     4  0.7987 0.42199
#> time:treatment 6.3186 3.15932     2     8  3.7258 0.07186 .
#> ---
#> Signif. codes:  0 '***' 0.001 '**' 0.01 '*' 0.05 '.' 0.1 ' ' 1
#>
#> Fold Change table
#>         contrast     FC pvalue sig    LCL    UCL     se Lower.se Upper.se
#> 1          time1 1.0000 1.0000     0.0000 0.0000 0.7036   0.6140   1.6286
#> 2 time2 vs time1 1.2556 0.5540     0.4381 3.5987 0.5323   0.8682   1.8159
#> 3 time3 vs time1 2.5432 0.0351   * 0.8873 7.2895 0.7074   1.5575   4.1527

a1 <- a$FC_statistics_of_the_main_factor
b1 <- b$FC_statistics_of_the_main_factor
c <- rbind(a1, b1)
c$gene <- factor(c(1,1,1,2,2,2))
c
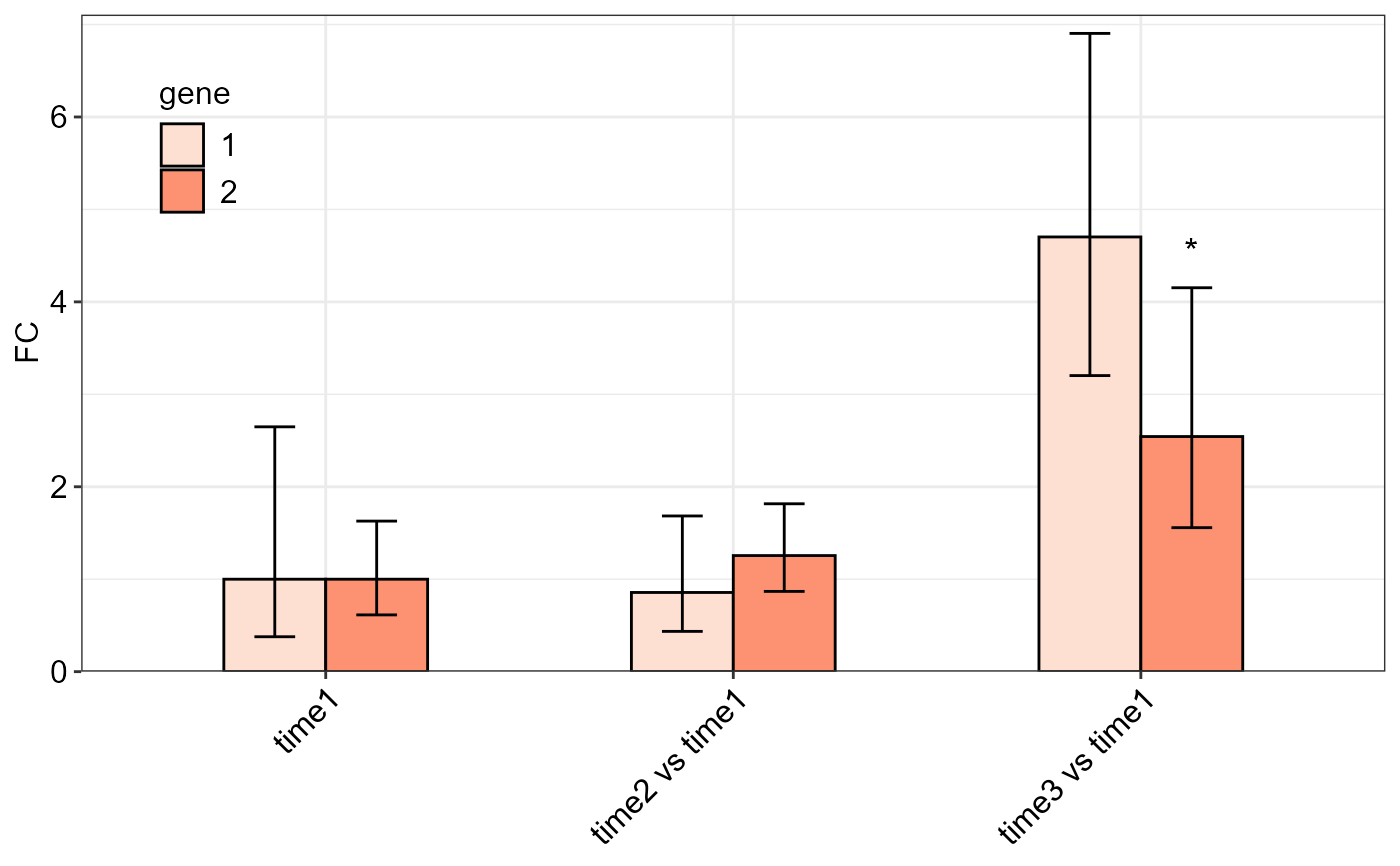
#>         contrast     FC pvalue sig    LCL     UCL     se Lower.se Upper.se gene
#> 1          time1 1.0000 1.0000     0.0000  0.0000 1.4051   0.3776   2.6484    1
#> 2 time2 vs time1 0.8566 0.8166     0.0923  7.9492 0.9753   0.4357   1.6841    1
#> 3 time3 vs time1 4.7022 0.0685   . 0.5067 43.6368 0.5541   3.2026   6.9040    1
#> 4          time1 1.0000 1.0000     0.0000  0.0000 0.7036   0.6140   1.6286    2
#> 5 time2 vs time1 1.2556 0.5540     0.4381  3.5987 0.5323   0.8682   1.8159    2
#> 6 time3 vs time1 2.5432 0.0351   * 0.8873  7.2895 0.7074   1.5575   4.1527    2

twoFACTORplot(c, x.axis.factor = contrast,
              group.factor = gene, fill = 'Reds',
              ylab = "FC", axis.text.x.angle = 45,
              errorbar = "se", y.axis.adjust = 1,
              axis.text.x.hjust = 1)
