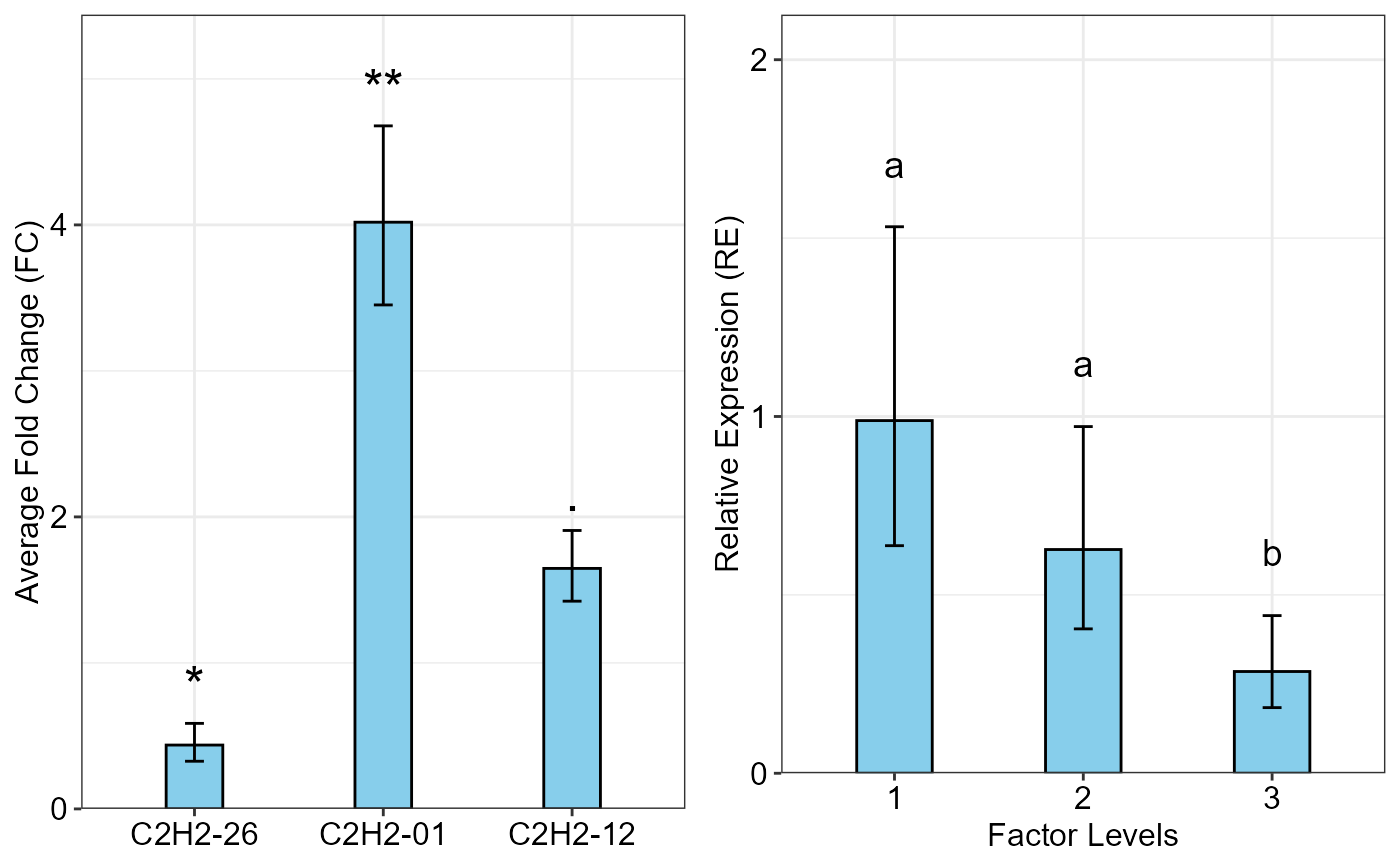
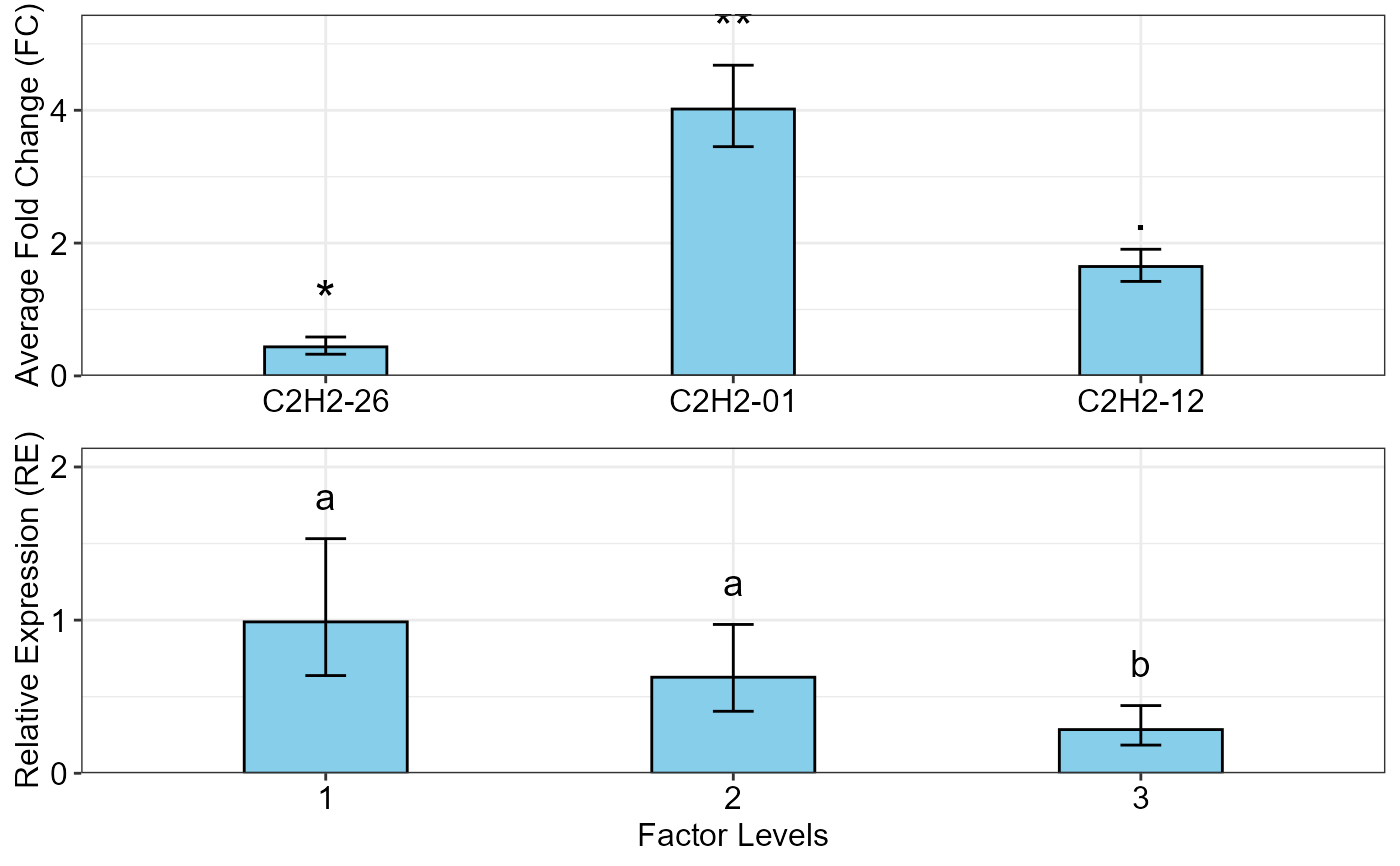
multiplot function combines multiple ggplot objects into a single plate.
multiplot(..., cols = 1)Arguments
- ...
ggplot objects can be passed in ... or to plotlist (as a list of ggplot objects)
- cols
Number of columns in the panel
Value
A multiple-plots plate
Details
Combining multiple ggplot objects into a single plate.
Examples
p1 <- qpcrTTESTplot(data_ttest,
                    numberOfrefGenes = 1,
                    ylab = "Average Fold Change (FC)",
                    width = 0.3)


out2 <- qpcrANOVARE(data_1factor, numberOfrefGenes = 1, block = NULL)$Result
#> Analysis of Variance Table
#>
#> Response: wDCt
#>           Df Sum Sq Mean Sq F value   Pr(>F)
#> T          2 4.9393 2.46963  12.345 0.007473 **
#> Residuals  6 1.2003 0.20006
#> ---
#> Signif. codes:  0 '***' 0.001 '**' 0.01 '*' 0.05 '.' 0.1 ' ' 1
#>
#> Relative expression table
#>   SA     RE    LCL    UCL     se Lower.se Upper.se letters
#> 1 L3 0.9885 0.6379 1.5318 0.0841   0.9325   1.0478      a
#> 2 L2 0.6271 0.4047 0.9717 0.4388   0.4626   0.8500      a
#> 3 L1 0.2852 0.1840 0.4419 0.0208   0.2811   0.2893       b
p2 <- oneFACTORplot(out2,
                    width = 0.4,
                    fill = "skyblue",
                    y.axis.adjust = 0.5,
                    y.axis.by = 1,
                    errorbar = "ci",
                    show.letters = TRUE,
                    letter.position.adjust = 0.1,
                    ylab = "Relative Expression (RE)",
                    xlab = "Factor Levels",
                    fontsize = 12)

multiplot(p1, p2, cols=2)

#> $plot
#>

multiplot(p1, p2, cols=1)

#> $plot
#>