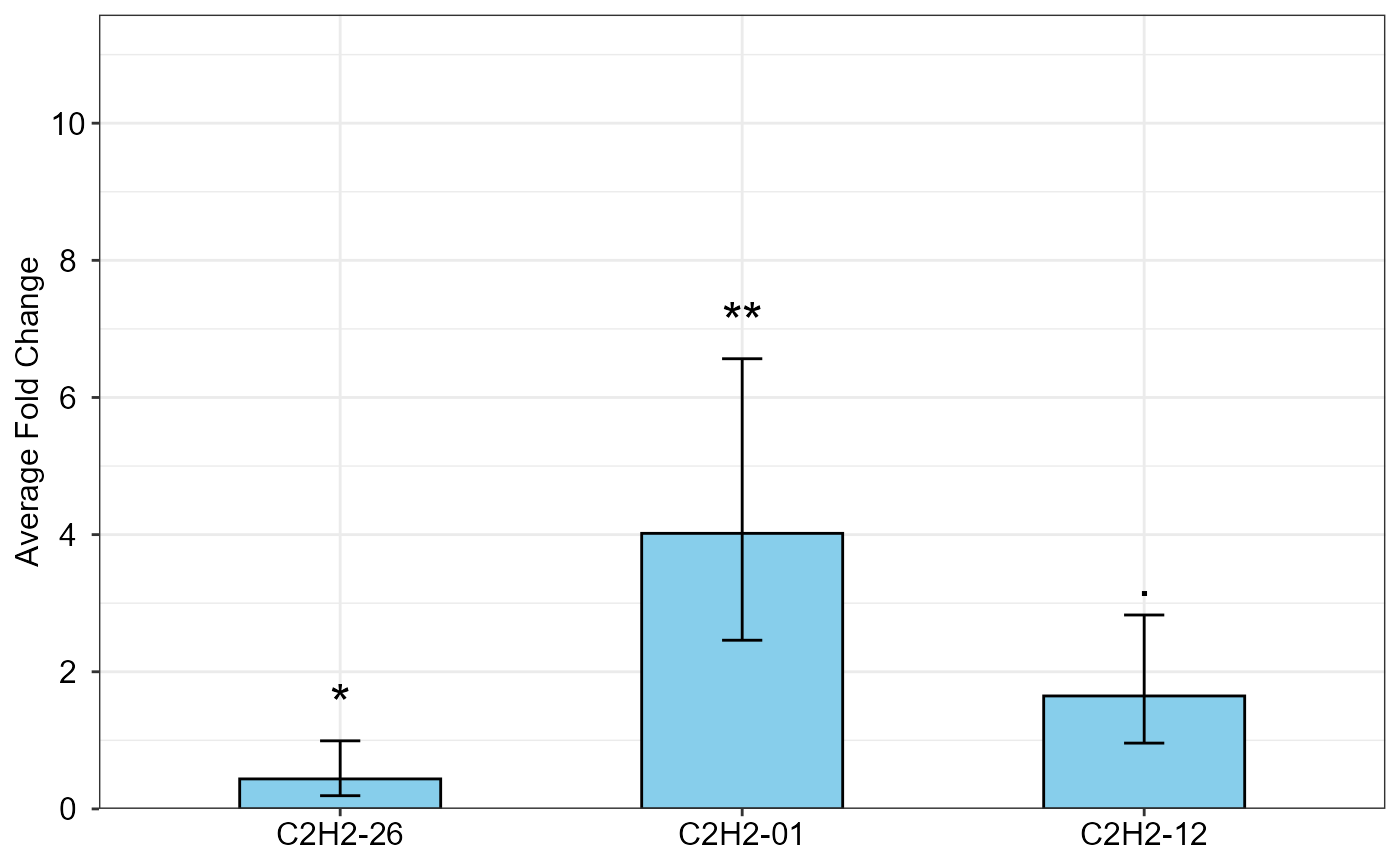
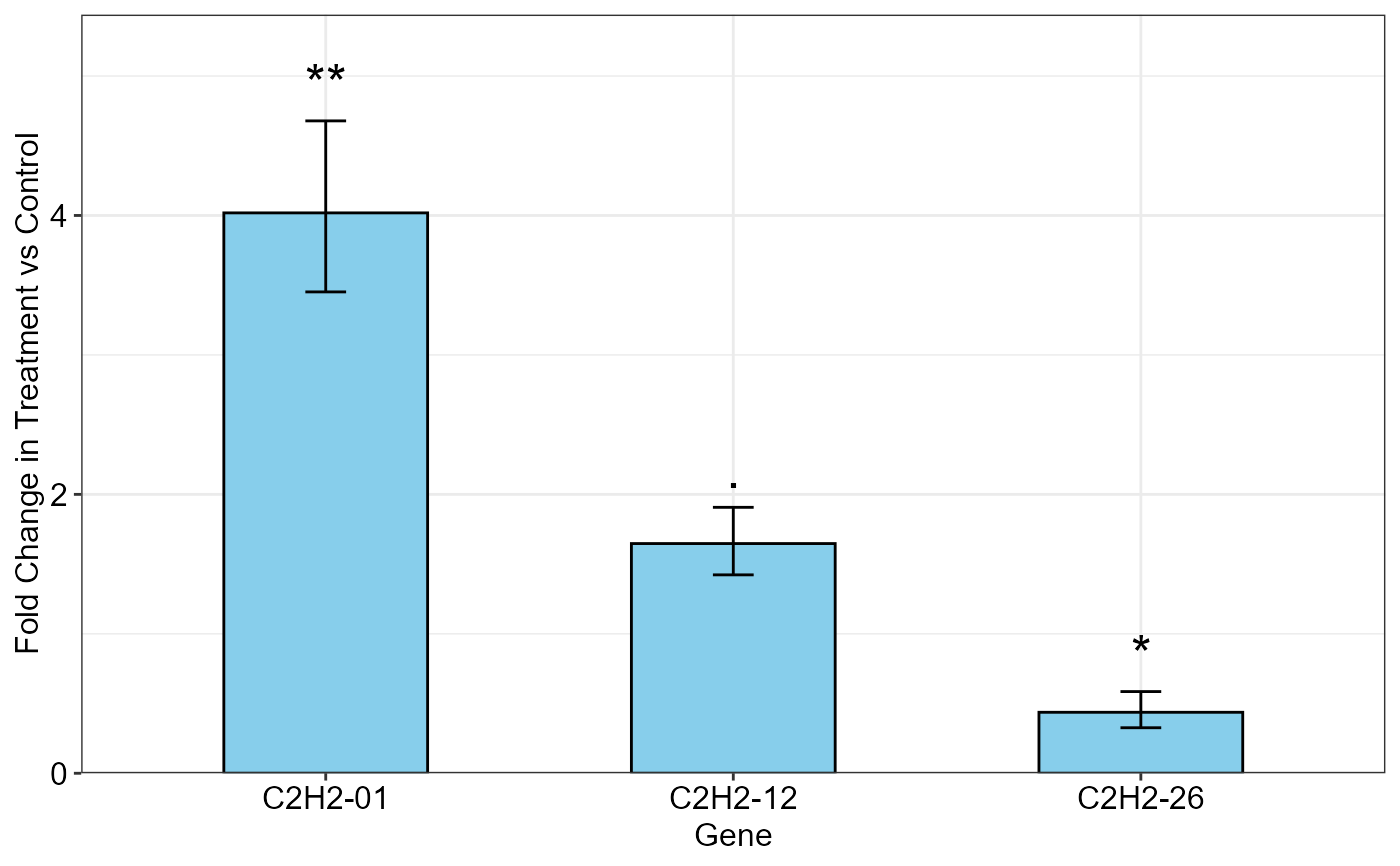
Bar plot of the average fold change (\(\Delta \Delta C_T\) method) of target genes
Source:R/qpcrTTESTplot.r
qpcrTTESTplot.RdBar plot of the fold change (\(\Delta \Delta C_T\) method) values for for any number of target genes under a two-level conditional experimental (e.g. control and treatment).
qpcrTTESTplot(
  x,
  order = "none",
  numberOfrefGenes,
  paired = FALSE,
  var.equal = TRUE,
  width = 0.5,
  fill = "skyblue",
  y.axis.adjust = 0,
  y.axis.by = 2,
  letter.position.adjust = 0.3,
  ylab = "Average Fold Change",
  xlab = "none",
  fontsize = 12,
  fontsizePvalue = 7,
  axis.text.x.angle = 0,
  axis.text.x.hjust = 0.5,
  errorbar = "se"
)
Arguments
- x
a data frame. The data frame consists of 4 columns belonging to condition levels, E (efficiency), genes and Ct values, respectively. Each Ct in the following data frame is the mean of technical replicates. Complete amplification efficiencies of 2 is assumed here for all wells but the calculated efficienies can be used we well. We use this data set for fold change expression analysis of the target genes in treatment condition compared to normal condition. See
vignettefor details.- order
a vector determining genes order on the output graph.
- numberOfrefGenes
number of reference genes. Up to two reference genes can be handled.
- paired
a logical indicating whether you want a paired t-test.
- var.equal
a logical variable indicating whether to treat the two variances as being equal. If TRUE then the pooled variance is used to estimate the variance otherwise the Welch (or Satterthwaite) approximation to the degrees of freedom is used.
- width
a positive number determining bar width.
- fill
specify the fill color for the columns of the bar plot.
- y.axis.adjust
a negative or positive value for reducing or increasing the length of the y axis.
- y.axis.by
determines y axis step length
- letter.position.adjust
adjust the distance between the signs and the error bars.
- ylab
the title of the y axis
- xlab
the title of the x axis
- fontsize
fonts size of the plot
- fontsizePvalue
font size of the pvalue labels
- axis.text.x.angle
angle of x axis text
- axis.text.x.hjust
horizontal justification of x axis text
- errorbar
Type of error bar, can be
seorci.
Value
Bar plot of the average fold change for target genes along with the significance and the 95 percent CI as error bars.
Details
The qpcrTTESTplot function applies a t.test based analysis to any number of target genes
along with one or two reference gene(s), that have been evaluated under control and treatment conditions.
It returns the bar plot of the fold change (FC) values for target genes along with the 95% CI and significance.
Sampling may be unpaired or paired. Unpaired and paired samples are commonly analyzed using unpaired and
paired t-test, respectively.Paired samples in quantitative PCR refer to two sample data that are collected
from one set of individuals
at two different conditions, for example before and after a treatment or at two different time points. While
for unpaired samples, two sets of individuals are used: one under untreated and the other set under treated
condition. Paired samples allow to compare gene expression changes within the same individual, reducing
inter-individual variability.
Examples
# See a sample data frame
data_ttest
#>    Condition    Gene E    Ct
#> 1    control C2H2-26 2 31.26
#> 2    control C2H2-26 2 31.01
#> 3    control C2H2-26 2 30.97
#> 4  treatment C2H2-26 2 32.65
#> 5  treatment C2H2-26 2 32.03
#> 6  treatment C2H2-26 2 32.40
#> 7    control C2H2-01 2 31.06
#> 8    control C2H2-01 2 30.41
#> 9    control C2H2-01 2 30.97
#> 10 treatment C2H2-01 2 28.85
#> 11 treatment C2H2-01 2 28.93
#> 12 treatment C2H2-01 2 28.90
#> 13   control C2H2-12 2 28.50
#> 14   control C2H2-12 2 28.40
#> 15   control C2H2-12 2 28.80
#> 16 treatment C2H2-12 2 27.90
#> 17 treatment C2H2-12 2 28.00
#> 18 treatment C2H2-12 2 27.90
#> 19   control     ref 2 28.87
#> 20   control     ref 2 28.42
#> 21   control     ref 2 28.53
#> 22 treatment     ref 2 28.31
#> 23 treatment     ref 2 29.14
#> 24 treatment     ref 2 28.63


qpcrTTESTplot(data_ttest,
              numberOfrefGenes = 1,
              errorbar = "ci")
#> $plot

#>


# Producing the plot
qpcrTTESTplot(data_ttest,
              numberOfrefGenes = 1,
              order = c("C2H2-01", "C2H2-12", "C2H2-26"),
              paired = FALSE,
              var.equal = TRUE,
              width = 0.5,
              fill = "skyblue",
              y.axis.adjust = 0,
              y.axis.by = 2,
              letter.position.adjust = 0.3,
              ylab = "Fold Change in Treatment vs Control",
              xlab = "Gene",
              errorbar = "se")
#> $plot

#>
# Producing the plot
qpcrTTESTplot(data_ttest,
numberOfrefGenes = 1,
order = c("C2H2-01", "C2H2-12", "C2H2-26"),
paired = FALSE,
var.equal = TRUE,
width = 0.5,
fill = "skyblue",
y.axis.adjust = 0,
y.axis.by = 2,
letter.position.adjust = 0.3,
ylab = "Fold Change in Treatment vs Control",
xlab = "Gene",
errorbar = "se")
#> $plot
 #>
#>