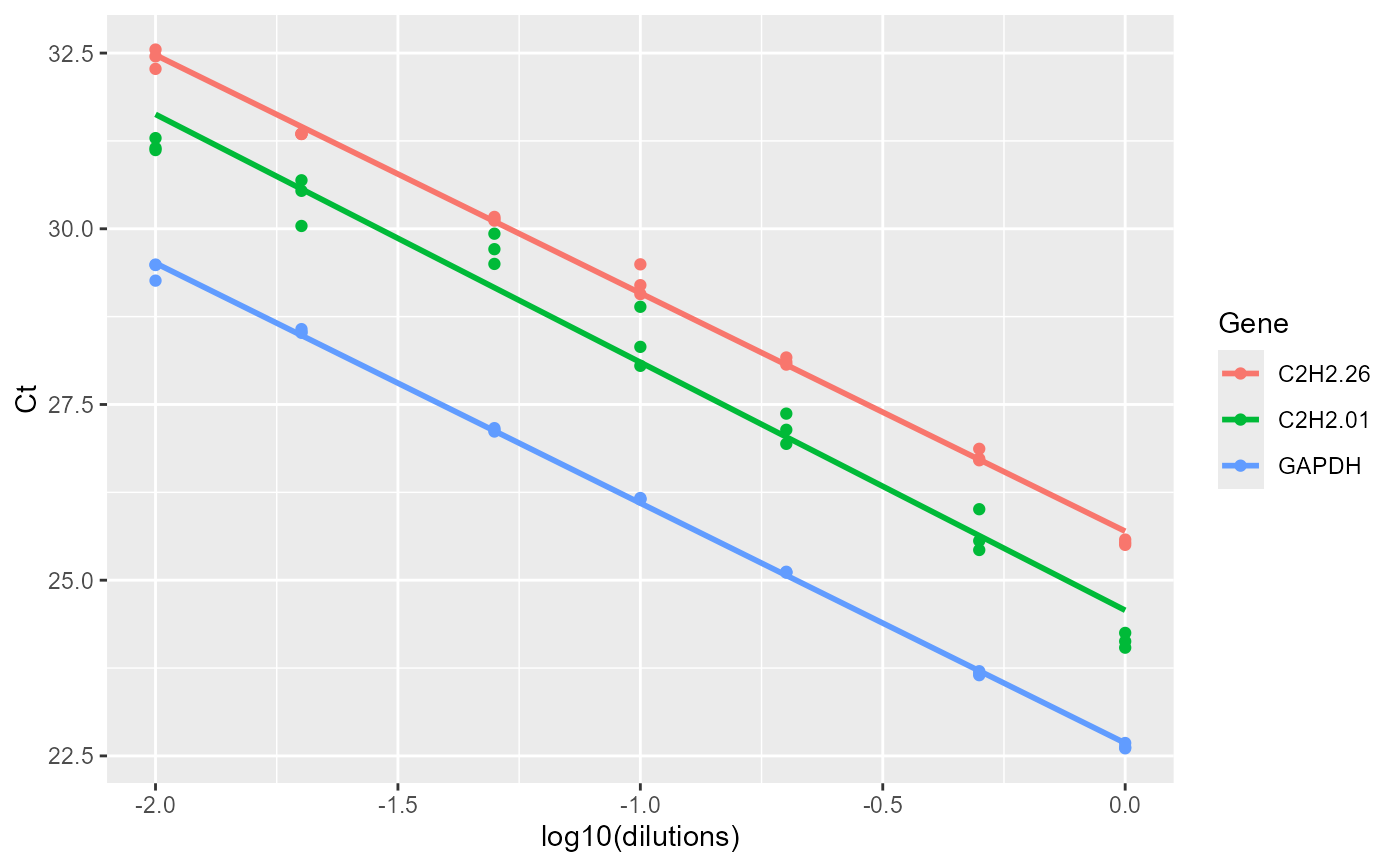
The efficiency function calculates amplification efficiency and returns related statistics and standard curves.
efficiency(df)Arguments
- df
a data frame of dilutions and Ct of genes. First column is dilutions and other columns are Ct values for different genes.
Value
A list 3 elements.
- efficiency
Slope, R2 and Efficiency (E) statistics
- Slope_compare
slope comparison table
- plot
standard curves
Details
The efficiency function calculates amplification efficiency of genes, and present the Slope, Efficiency, and R2 statistics.
Examples
# locate and read the sample data
data_efficiency
#>    dilutions  C2H2.26 C2H2.01    GAPDH
#> 1       1.00 25.57823   24.25 22.60794
#> 2       1.00 25.53636   24.13 22.68348
#> 3       1.00 25.50280   24.04 22.62602
#> 4       0.50 26.70615   25.56 23.67162
#> 5       0.50 26.72720   25.43 23.64855
#> 6       0.50 26.86921   26.01 23.70494
#> 7       0.20 28.16874   27.37 25.11064
#> 8       0.20 28.06759   26.94 25.11985
#> 9       0.20 28.10531   27.14 25.10976
#> 10      0.10 29.19743   28.05 26.16919
#> 11      0.10 29.49406   28.89 26.15119
#> 12      0.10 29.07117   28.32 26.15019
#> 13      0.05 30.16878   29.50 27.11533
#> 14      0.05 30.14193   29.93 27.13934
#> 15      0.05 30.11671   29.71 27.16338
#> 16      0.02 31.34969   30.69 28.52016
#> 17      0.02 31.35254   30.54 28.57228
#> 18      0.02 31.34804   30.04 28.53100
#> 19      0.01 32.55013   31.12 29.49048
#> 20      0.01 32.45329   31.29 29.48433
#> 21      0.01 32.27515   31.15 29.26234

# Applying the efficiency function
efficiency(data_efficiency)
#> $Efficiency
#>      Gene     Slope        R2        E
#> 1 C2H2.26 -3.388094 0.9965504 1.973110
#> 2 C2H2.01 -3.528125 0.9713914 1.920599
#> 3   GAPDH -3.414551 0.9990278 1.962747
#>
#> $Slope_compare
#> $emtrends
#>  variable log10(dilutions).trend     SE df lower.CL upper.CL
#>  C2H2.26                   -3.39 0.0856 57    -3.56    -3.22
#>  C2H2.01                   -3.53 0.0856 57    -3.70    -3.36
#>  GAPDH                     -3.41 0.0856 57    -3.59    -3.24
#>
#> Confidence level used: 0.95
#>
#> $contrasts
#>  contrast          estimate    SE df t.ratio p.value
#>  C2H2.26 - C2H2.01   0.1400 0.121 57   1.157  0.4837
#>  C2H2.26 - GAPDH     0.0265 0.121 57   0.219  0.9740
#>  C2H2.01 - GAPDH    -0.1136 0.121 57  -0.938  0.6186
#>
#> P value adjustment: tukey method for comparing a family of 3 estimates
#>
#>
#> $plot

#>
#>